

There were no big surprises in today’s Office for National Statistics’ 2nd estimate of UK GDP for the first quarter of 2015 – except on the part of those who expected it to be higher than the first. The economy “grew” 0.3% from Q4 2014, and compared to Q1 2014 it was 2.4% up (unchanged). Services’ output continued to rise while production was stagnant and construction output fell. The trade gap widened, and this had a negative impact on GDP.
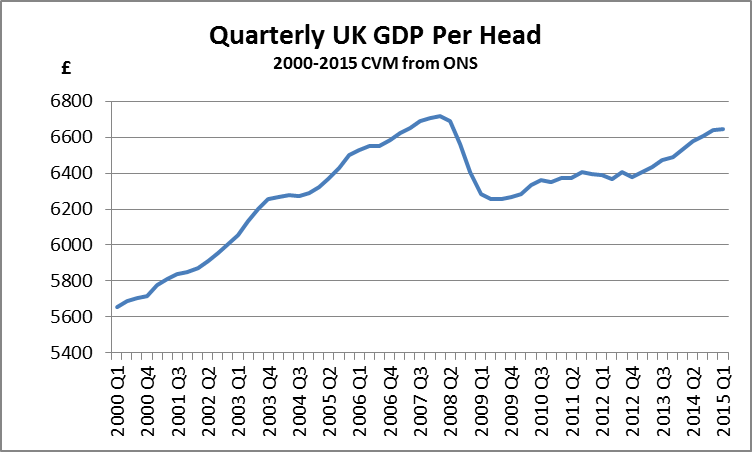
Significantly, GDP per head hardly moved from Q4 (up just 0.1%), since the rise in population is almost equal to the increase in economic activity. Indeed, quarterly real GDP per head is still below the level it reached in 2006 to 2008, for seven successive quarters (Q4 2006 to Q2 2008) as the following chart shows:
The following chart shows how limited the revival in GDP per head (year on year) has been since 2009. It also shows (blue line covering Conservative or Con/Lib governments, red line Labour) that there have been four periods since 1956 when real GDP per head has fallen year on year – and three out of four were under Conservative governments. (The fourth, in 2009, was of course a bigger percentage fall).


