Earlier this week, the World Trade Organisation published its latest trade statistics and outlook – and was in pessimistic mode:
“World trade will grow more slowly than expected in 2016, expanding by just 1.7%, well below the April forecast of 2.8%…. The forecast for 2017 has also been revised, with trade now expected to grow between 1.8% and 3.1%, down from 3.6% previously. With expected global GDP growth of 2.2% in 2016, this year would mark the slowest pace of trade and output growth since the financial crisis of 2009.”
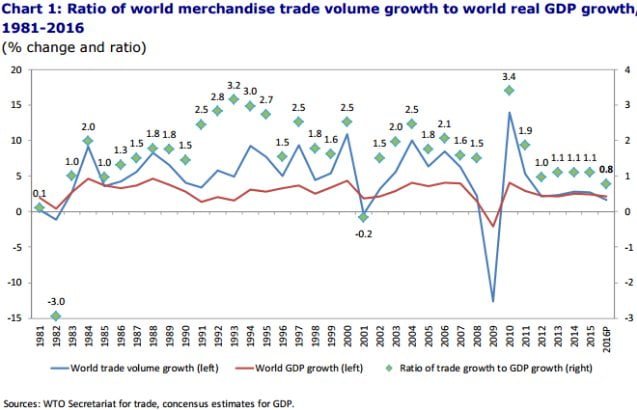
The latest figures, says the WTO, are “a disappointing development and underline a recent weakening in the relationship between trade and GDP growth”. While trade has typically grown in recent decades at 1.5 times faster than GDP, the ratio has in recent years slipped towards 1:1.
Here is the WTO’s chart that tracks GDP and trade volumes over the last 35 years – since near the start of the globalisation era.
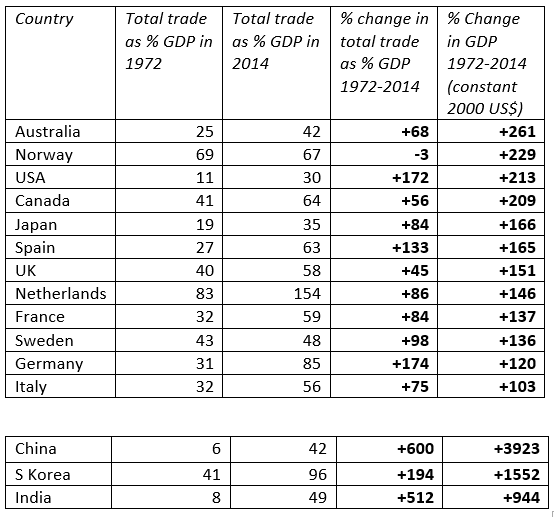
But the relationship between trade and GDP for individual countries is far less clear. I have looked at a set of 15 countries – 12 so-called “advanced economies”, and 3 “emerging economies”, over the period 1972 to 2014 (1972 being the year the UK joined what became the EU, and also the effective start of the North Sea oil and gas era).
In the Table below, I have calculated the increases in GDP, and placed the countries in sequence according to their percentage increase. Alongside this, I have taken the figures for total trade as a percentage of GDP for the years 1972 and 2014, and calculated the percentage change between the years. Of course, this second calculation is not to compare directly with the GDP increase, as it is not the volume that is measured, but the share of trade in the economy.
That said, it shows (a) that trade has increased as a share of the economy in every country looked at except Norway, but (b) the extent of change in this share differs enormously between countries – and is not correlated in any evident way with the rate of increase in GDP.
To take one example, trade as a share of the economy in Italy is almost identical to that in the UK (and France) – yet Italy’s GDP has increased by far less than the UK’s over the 42 years.