This article was first published in the Royal Economic Society Newsletter, July 2016.
Six years into fiscal consolidation policies around the world, economists are wholly preoccupied with supply rather than demand. Productivity figures are regarded as indicating structural flaws, of far greater interest than the successes or otherwise of governments’ fiscal strategies. This article by Geoff Tily [1], argues that it is a fallacy to interpret failures of productivity outcomes as indicating a failure of supply. The disregard for the demand story is deeply problematic in practice.
” I must tell the House that we face such a challenge now. Financial markets are turbulent. Productivity growth across the west is too low … The OBR also note that this reflects concerns across the West about low productivity growth. The Secretary General of the OECD said last month that ‘productivity growth… has been decelerating in a vast majority of countries’. As a result, the most significant change the OBR have made since their November forecast is their decision to revise down potential UK productivity growth.” Chancellor George Osborne, Budget Speech, 16 March 2016
Productivity statistics dominate the interpretation of economic conditions and policy options. Even in spite of an inability to explain outcomes, almost unanimously and continuously the figures are interpreted as indicating deficient conditions of supply. Any weakness in the economy is repeatedly deemed structural rather than cyclical, and policy relentlessly driven on the present contractionary setting.
The OBR illustrates the unanimity of opinion in the UK with a comparison of output gap estimates across various institutions (see figure 1).[2]
Twelve of 15 institutions regard the output gap as less than -½ per cent, indicating no spare capacity in practical effect. Only two institutions (both non-banks) step gingerly outside the consensus.
Figure 1: Estimates of the output gap in 2015

But it is a fallacy to interpret productivity outcomes as indicating a failure of supply. It is wrong to use productivity outcomes to avoid discussing fiscal policy. The practical implications of this latest consensus in the profession are far from trivial.
The macroeconomic case for demand
The fallacy has been re-enforced by inadequate statements of the demand case. These generally rely on market failures: sluggish adjustment of labour to reduced demand or inadequate investment. Neither are strictly demand explanations and both are difficult to demonstrate decisively. The appropriate demand case is based on macroeconomic not microeconomic reasoning (owed originally to Martin and Rowthorne, 2012)[3]; it is simply stated in three steps:
- Weaker economic outcomes follow from inadequate aggregate demand, and more specifically from reduced growth (or cuts) in government expenditure; inherent to the productivity fallacy is an underestimation of the impacts of cuts in spending, i.e. of the multiplier, or equivalently an overestimate of the extent of ‘crowding in’.
- The labour market has been forced to accommodate lower growth, and has done so through price — i.e. reduced wages and quality of work — rather than quantity, with employment numbers holding up.
- Low productivity is simply the residual of lower than normal economic growth against disproportionately higher employment growth.
Under the demand view causality is simply reversed, with productivity a symptom of wider economic conditions rather than a quantity with causal force.
The process can be simply illustrated using national accounts and labour market information. Starting with the expenditure decomposition of GDP, average annual growth and contributions by sector before and after the financial crisis are compared. Nominal figures are used: statistically, the output indicators used for government spending are unhelpful and the corresponding income measure of GDP is derived only in nominal terms; economically, prices are an outcome of interest and, in the short-run, wages and the state of the government’s coffers depend on nominal GDP.
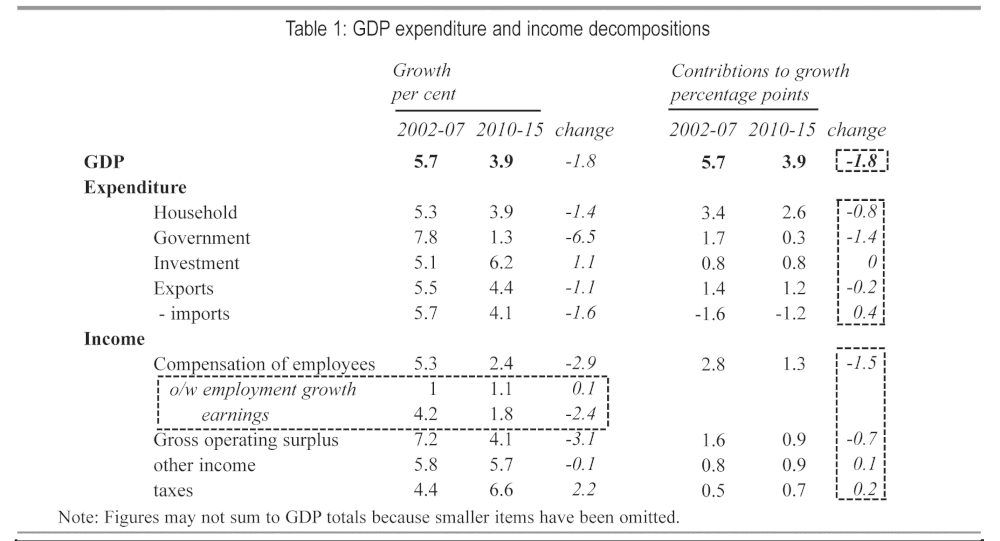
Table 1 shows growth rates and contribution to total UK growth by sector for the expenditure and income measures of GDP across pre- and post-crisis period and the change. The expenditure figures show 1.4 percentage points (ppts) of the 1.8 ppts shortfall in GDP growth accounted for by government final expenditure (consumption and investment). No private expenditure was crowded in, and household expenditure was also reduced. The OBR and others have attributed the weakness to the failure of the Eurozone, but trade figures are only marginally less weak than before the crisis (and exports are are still a demand factor).
The corresponding comparison of income figures shows the reduction in growth shared between labour (-1.5 ppts) and capital (-0.7 ppts), though the former more disadvantaged. The key action for productivity is illustrated by deconstructing the growth in compensation of employees between jobs and earnings, shown also in Table 1. (This can only be done as an approximation: here the sum of aggregate employment and average weekly earnings growth; NB compensation of employees also includes employers’ contributions to pensions.)
So the whole of the adjustment in labour income is accounted for by wages rather than employment. International comparisons show the UK labour market was one of several that adjusted in this way (TUC, 2015).[4]
A question of identification
To this point the argument shows how weak productivity outcomes are not inconsistent with weak demand, not that they are caused by weak demand. The relation between productivity and wages is an accounting identity, and the economic problem one of identification.
Though without going any further output gap estimates are put into context. The shortfall in ‘productivity’ is essentially arbitrary according to any projection of a preceding rate of growth from a specific point in time. As repeated ad nauseam, in the UK productivity is around 16 per cent below its pre-crisis trend; it is around 9 per cent below the OBR’s projection in 2010. Set against this scale of a shortfall, the miniscule range of output gap forecasts illustrate the extent of the bias to the supply view.
Identification depends on wider evidence for the dominant factor. The evidence for demand follows from an extension of the UK analysis to all OECD countries, and the brutal, natural experiment underway since 2010.
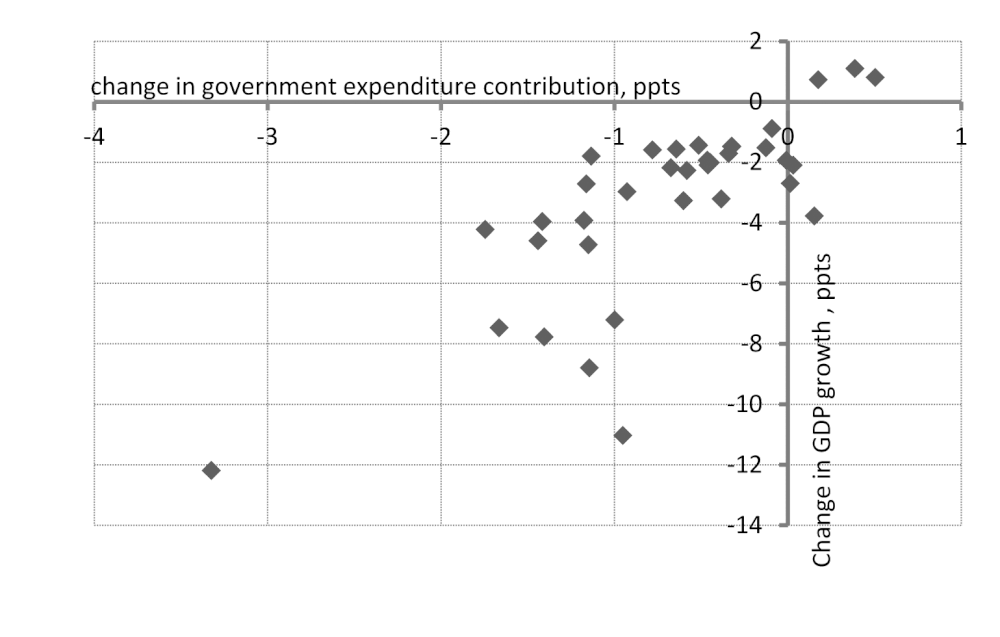
A simplistic but probably adequate regression of the change in government expenditure contributions against the change in GDP growth between pre- and post-crisis periods has a slope of around 3, loosely indicative of the multiplier (and a correlation of 0.76). Though high, this is hardly novel: in their October 2012 World Economic Outlook, the IMF conceded ‘multipliers have actually been in the 0.9 to 1.7 range since the Great Recession’, when previously ‘fiscal multipliers were near 0.5 in advanced economies during the three decades leading up to 2009’ (Box 1.1).

In the meantime, inherent to the notion of a ‘productivity puzzle’ is the inability of commentators to find a satisfactory supply-side explanation (let alone one that might explain outcomes across all OECD countries). Indeed the most compelling contributions are ones that rule out various specific supply accounts.[5]
Figure 2: GDP growth and government spending: change pre- to post-crisis

Correspondingly — and crucially — it is difficult to reconcile unprecedented lows for inflation with defective supply. (Notably the OBR barely try, though the Bank of England have not given up.) The evidence strongly suggests that the ongoing weakness in economic activity is caused by deficient demand.
Practical implications
Obviously this is a matter of the greatest importance. On the basis of the productivity fallacy, the failure of one round of spending cuts is leading blindly to another. Politicians and policymakers around the world may claim absolution (quote at start), but their actions are crushing activity, wages and the quality of work, as well as public services and social provision. There can be no end on the present course. The actions serve no reasonable economic purpose, with, furthermore, not the slightest dent made in seriously elevated public debt ratios across the world (there are a couple of exceptions, not least Germany).
In this Newsletter six years ago, Chick and Pettifor were reported arguing ‘fiscal consolidation increases rather than reduces the level of public debt as a share of GDP and is in general associated with adverse macroeconomic conditions’.[6] Others contested their view, but public debt ratio outcomes to date are with Chick and Pettifor. On a realistic view of the output gap (or rather spare capacity), the threat of deflation will not go away (and the impact is already very obvious in the steel and oil industries). This is a toxic prospect, given the unprecedented levels of private debt in the UK and globally.
None of this is to deny serious supply-side defects, not least in the financial sector and in public infrastructure spending. But the dominant factor driving statistical outcomes on a short horizon is demand, and supply cannot be addressed without momentum from demand.
It is not clear whether the consensus around the output gap is the result of blind application of mechanical processes (so-called real-time output-gaps). But the associated application of long-run theory to short-run outcomes, the belief in ‘crowding-in’ and in incredibly low multipliers, let alone the willingness to countenance an extreme expansion of central bank balance sheets, is hardly uncontroversial.
But of course the analytics are essential to holding the line on the necessity of cuts and keeping the possibility of expansionary fiscal policy off the table. The impression is of a profession that would prefer to discuss productivity so as to not rock the boat. I should note that I have shared and in some cases discussed these arguments with policymakers and other economists; the basic argument has not been contested, but it is ignored in practice.
Policymakers and economists need to recognise that the consensus portrayed on the OBR chart is entirely devoid of rational or scientific content. Given that their business is not primarily ideological, a more impartial and considered reading of the evidence is to be expected.
Notes:
1. Geoff Tily is senior economist at the TUC and the author of Keynes Betrayed (Palgrave, 2010).
2. Source: Office for Budget Responsibility (2016) Economic and Fiscal Outlook, Chart 3.4.
3. Bill Martin and Robert Rowthorn (2012) ‘Is the British economy supply constrained II? A renewed critique of productivity pessimism’, Centre for Business Research, University of Cambridge, May.
4. TUC (2015), ‘Productivity: no puzzle about it’.
5. E.g. Jonathan Haskel, Peter Goodridge and Gavin Wallis (2015) ‘Accounting for the UK productivity puzzle: a decomposition and predictions’.


