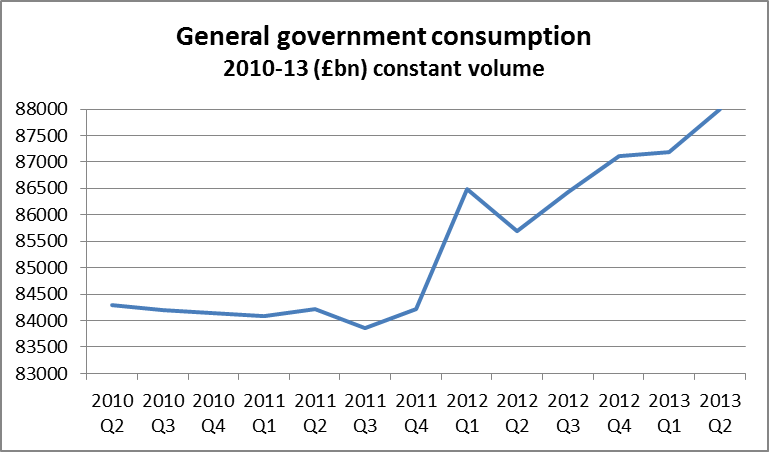
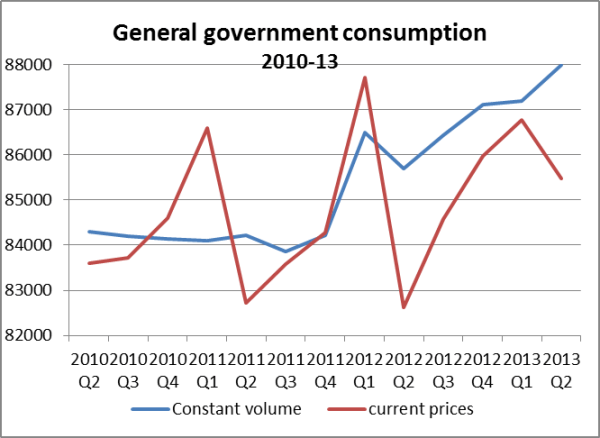
This “deflation” should represent a big increase in productivity by the public sector, and we do not say there has been none. But we are certain this is not a realistic assessment. Public sector productivity is relatively crudely assessed by output measures, which cannot and do not capture much of what was/is done, or what has been lost in the cuts.
Healthcare, education and social care represent about 60% of general government consumption – all of these are notoriously difficult to measure objectively, combining shifting (currently mainly growing) client numbers and proxy quality measures of variable reliability. One thing is certain – they do not capture all the positive aspects of services carried out until recently by public service workers, especially at local level, and which have been lost amid the great austerity cull.
In a very good analysis, the Socialist Economic Bulletin has recently pointed out – with this photo from the ONS Statistical Bulletin for Q2 – that the entire increase in constant volume GDP between Q4 of 2011 and Q2 2013 equals almost exactly the increase in government consumption over this period. So as we said at the start of this post, if no increase in government consumption, no increase in GDP! Here are the stats to show this:
SEB make the point, which we have also made, that the big drag on GDP has been the enormous falls in capital investment (GFCF) in both private and public sectors. You can see from the table that the 1st half of 2013 is one of the lowest ever for capital spending (worse still in non-seasonally adjusted figures).
Conclusions
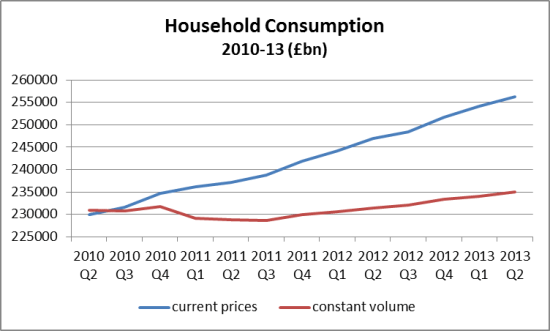
We reach some unexpected conclusions from the data. In % constant volume terms, general government consumption has outstripped household consumption between Q2 2010 and Q2 2013. Yet in current prices, household consumption has risen by 11.4% over the 3 years, while government consumption is up by just 2.2%. This tiny increase in “government consumption” in nominal terms is clear evidence that the spending cuts (the austerity) are real – and, we would add, with damaging consequences for any true assessment of economic activity.
So now, we have another GDP/productivity puzzle – this time for the public sector. How can the public sector have apparently contributed so much to the (admittedly small) increase in GDP so far? Does the methodology for GDP underestimate the impact of major reductions in public services, and thus overestimate “growth” via a flawed deflator? We believe this is the case. The existing methodology for assessing public sector non-market productivity can be exceptionally complex (see the ONS on healthcare for example), but inputs are a major component, so reducing headcount and pay will feed through rapidly as gains, even if overall true quality – for service users and staff – declines.
But the fact remains – on the basis current statistics, the “recovery” to the end of June 2013 depends as much on changes in levels of activity in the public sector as in the private sector.
It should have been a recovery driven at the outset by public sector investment, while the private sector deleveraged from its debt-fuelled excesses (a process still far from complete). Instead, it is indeed the public sector that has statistically helped to drive the very modest ‘recovery’ to date – but through a perverse logic whereby big public sector cuts become alchemically metamorphosed (sliced and diced)into increases in economic activity for the purposes of GDP!
Thanks to Tim Harford and BBC Radio 4’s “More or Less”, and to Michael Burke, for in different ways stimulating me into doing this post! Both were on to the mysteries of GDP and government consumption/spending.
[1] constant volume measure, CVM.


2 responses
To be strictly accurate, Neil’s point needs refining a bit, and as follows.
A government has the right to alter the proportion of GDP allocated to public spending at the start of a recession or at any other time. So if a government wanted to increase that proportion in a recession, it could actually do so. And as to the problems involved in sudden increases in public sector investment spending (to which Neil rightly refers) that can be avoided by allocating most of the money to public sector CURRENT rather than capital spending.
“It should have been a recovery driven at the outset by public sector investment”
Should it? One person’s investment is another person’s white elephant.
If the government trains everybody in Brain Surgery and Nuclear Physics, which category does that expenditure go in?
Public sector investment is a poor counter-cyclical response tool. You can’t shut off projects that easily once they are started and you need schools, etc. whatever the weather in the private sector.
So Public sector investment should always be covered by equivalent taxation to ensure that the resources are available for the project to complete and should carry on at roughly the same rate during boom and bust.
Counter-cyclical measures involve enhancing the auto-stabilisers so that they prop up private demand properly during a deleverage cycle and dampen off private demand properly during a boom.