

The current false “truth” endlessly repeated by those who would benefit from its propagation, and by those who should know better, is that Labour governments are fiscally profligate and/or incompetent compared to other parties’ governments.
We have therefore looked at the respective records of both Conservative and Labour governments over the recent decades, and find that on several key indicators, including budget deficits and surpluses, Labour governments have been on balance more fiscally “conservative” than Conservative or Conservative-led governments.
The financial crisis of 2008/9, with its consequent economic and fiscal fall-out, resulted not from fiscal profligacy but from foolish financial deregulation policies and over-reliance on the finance sector, for which all main political parties were responsible. And while the deficit resulting (and required) to deal with it was the highest as a share of GDP in the post-war period, the economic and fiscal policies of the Conservative-led Coalition also resulted in the slowest economic recovery from recession in that post-war period, allied to a snail-pace deficit reduction rate.
Summary of key points:
Public spending
- Within the UK, since 1972/3 (the start of the dataset) the highest three years for Total Managed Expenditure (TME) as a share of GDP were from 1974/5 to 1976/7. However, Mrs Thatcher’s early governments oversaw the highest sustained 5 year period of public spending as a share of GDP, with public spending that was 46% or more for a record 5 consecutive years, from 1980/81 to 1984/5.
- As regards UK public sector current spending (i.e. excluding capital spending), the highest figure as a percentage of GDP was 40.4% in 2009/10 under the Brown government. However, the highest sustained period of current spending was under the Thatcher government, from 1981/2 to 1984/5. Her government also saw a higher level of current spending as a share of GDP for 6 consecutive years than in any year of the 1974/9 Labour government.
Budget deficits
- Looking at current budget deficits or surpluses (i.e. excluding public investment), for the period from 1956 to 2008, Conservative governments had an average annual surplus of 0.3% of GDP, while Labour governments had an average annual surplus of 1.1%.
- For the period starting 1970/1, In the case of Conservative governments, the average annual current deficit for this period is 0.6% of GDP, while for Labour governments over the same period, the average current budget deficit is 0.3% of GDP.
- Looking at overall budget deficits (i.e. including public investment) for the period 1970/1 to 2008, for Conservative governments, over this period the average annual overall deficit is 2.9% of GDP, while for Labour governments in the same period, the average overall deficit is 2.6% of GDP.
Public investment
- Conservative governments, over the period 1971 to 2008, spent a higher percentage of GDP on average on public investment than did Labour governments (this excludes PFI), whether one looks at gross or net investment. Gross investment per year by Conservative governments was on average 5% of GDP, while that by Labour governments it was 4.3%.
Public debt
- Taking the period 1974 to 2008, the level of net debt as a share of GDP has fluctuated sharply under both Conservative and Labour governments (with a bigger fall under the 1979-97 Conservative government), but net debt as a percentage of GDP was lower at the end than at the start under each government than at its start, including the 1997 Labour government up till 2008.
- But once the financial crisis hit, the ratio worsened greatly, so that by the end of the Labour government, the debt to GDP ratio was some 25 percentage points higher than at the outset in 1997. Under the 2010-2015 Coalition government, the debt to GDP ratio rose further by around 18 percentage points.
- Taking the amount of annual debt interest payments as a share of GDP since 1964, these peaked under the 1979-97 Conservative government at 3.5%, and were lowest under the 1997-2010 Labour government at 2.3% of GDP. With the increase in public debt since 2009, this increased to 2.9% of GDP under the Coalition government
Unemployment rate
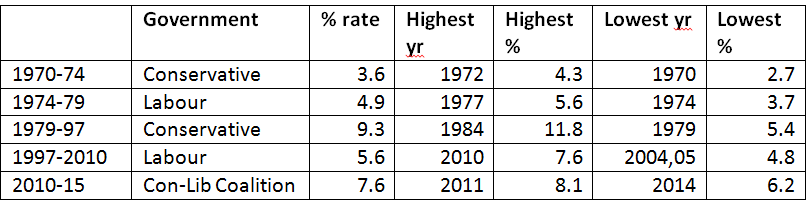
- Since 1970, the best average annual unemployment rate was achieved by the Heath Conservative government of 1970/4 with 3.4%, and by far the worst under the 1979/97 Conservative government, with an average annual rate of 9.3%, and exceeding 10% for 6 full years. The 1974/9 Labour government had an average rate of 4.9%, and the 1997-2010 government 5.6%. The 2010-15 Coalition government’s average rate was 7.6%.
The challenge!
On the BBC Radio 4 PM news programme last Friday, PRIME’s Ann Pettifor affirmed, in a debate on the “right size” of the state, that Labour governments have generally been more fiscally “conservative” than Conservative governments. David Smith, the Sunday Times’ economics correspondent, asked – fairly enough – on twitter what she meant by this, but seemed not to like the (wholly accurate) response that, for example, Labour governments since 1956 (the start of the ONS database) have on average had lower annual current budget deficits than Conservative governments. A big twitter debate ensued.
It seems to us that it is high time – given the relentless and continuing political attacks on Labour’s economic capability – to set the record straight on some key indicators. In fact, current (non-investment) budget deficits are far more a consequence of, and rational response to, financial liberalisation than of economic competence per se – but that’s a story for another blog. So here goes!
Public expenditure as a share of GDP
The longer-run level of public spending as a share of GDP is not, within reason, an issue of “fiscal rectitude”. Rather, it reflects the democratic political choices made by a people in a given country. But it is often used as if it were such a test, so we need to look at the true facts.
UK public expenditure (as shown by OECD and Eurostat data) is consistently below the EU average as a share of GDP – the list is topped as one would expect by Scandinavian countries but the UK is also below Germany as well as France, for example. We are roughly on a par (on this indicator) with Poland.
Within the UK, since 1972/3 the highest three years for Total Managed Expenditure (TME) were from 1974/5 to 1976/7 with 47%, 48.9%and 47.8% before it slipped back to 44.1% in the last year of the Labour government, and to 43.7% in 1979/80.
However, it was Mrs Thatcher’s early governments that saw the highest sustained 5 year period of public spending as a share of GDP – she oversaw public spending that was 46% or more for a record 5 consecutive years, from 1980/81 to 1984/5:
46%, 46.4%, 46.9%, 46.6%, 46.3%, before it fell back to 44% in 1985/6
The highest level since then was at the peak of the financial crisis on 2008/10, with TME reaching 45.7% in 2009/10.
As regards UK public sector current spending (i.e. excluding capital spending), the highest figure as a percentage of GDP was 40.4% in 2009/10.
However, the highest sustained period of current spending was again achieved by Mrs Thatcher’s government, from 1981/2 to 1984/5, with 40.1%, 40.3%, 39.9% and 40%
And Mrs Thatcher’s government had a higher level of current spending as a percentage of GDP for 6 consecutive years, starting in 1981/2, than in any year at all of the Wilson/Callaghan government (highest level, 38.3%).
So on the facts, Mrs Thatcher’s early governments were for 5 or 6 years, by a reasonable margin, the highest spending ones of any government (for better or for worse!), taking both TME and current spending into account, over the whole period to the present.
Budget deficits
Budget deficits (or surpluses) can be divided in two – (a) the overall deficit, including capital investment spending, and (b) the current budget deficit, before taking account of investment. We would contend that these are certainly indicators of degrees of “fiscal conservatism”, but in normal circumstances, a reasonable level of deficit is either necessary (in the course and aftermath of banking crises and other recessions) or in any event not a problem in itself. This is especially the case if the deficit is smaller as a % of GDP than the rise in GDP itself, since this means that public debt as a percentage of GDP will still be falling.
We have previously (here and here) looked at the respective track records of Conservative(-led) and Labour governments in respect of overall and current budget deficits over the last 25 years, showing that the Labour government on average had much lower deficits – even if one excludes the deficits during first 2 years of the 2010 Coalition government from the calculation. Some have argued that the start date may be unfair to the Conservative cause in this comparison, as the period includes the recession of the early 1990s when the Major government saw deficits almost as big as during the great financial crash of 2008/9.
So we have looked at longer periods, using ONS datasets.
Current budget deficit/surplus as a percentage of GDP
We have looked at the period from 1956 (when the published ONS dataset begins) to 2008, and taken the average current budget deficit or surplus over this period for Conservative and Labour governments respectively. There have of course been many ups and downs, for both Labour and Conservative governments, but long-run current budget deficits/surpluses appear to us to be one reasonable indicator for assessing “fiscal conservatism”, with lower average deficits being seen as more “conservative”.
On this indicator, in fact governments of both political parties show a current budget surplus, on average, over the long-run period. This is largely due to the fact that in the more stable (Bretton Woods) era before the 1970s and financial liberalisation, all governments almost always achieved a current surplus (but with high levels of public investment), while surpluses became much rarer in the more volatile post Bretton Woods era of financial deregulation.
Conservative governments have an average annual surplus of 0.3% of GDP over the 53 year period to 2008, while Labour governments have an average annual surplus of 1.1%.
(If we extend the period to 2015, i.e. to include the financial crisis and its aftermath, the gap would widen further as the Conservative-led coalition government saw large current deficits for 5 years, following very high peak-crisis deficits for 2 years under Labour. However, we feel it is more balanced to exclude the financial crisis data at this point).
We have also looked at the position from 1971 to 2008, and find that over this period, both Conservative and Labour governments have run on average a small current budget deficit.
In the case of Conservative governments, the average annual current deficit for this period is 0.6% of GDP, while for Labour governments over the same period, the average current budget deficit is 0.3% of GDP.
Therefore, looking at this one indicator in isolation, it is fair to say that Labour governments, over many years, have been somewhat more “fiscally conservative” than Conservative governments. We make this point as a matter of fact, not necessarily as our judgment of fiscal wisdom!
Overall budget deficit/surplus as a percentage of GDP
The overall budget deficit is arguably a less satisfactory indicator of “fiscal conservatism” since it includes borrowing for investment purposes, which may within reasonable bounds be seen as a positive, notably when (like now) long-term interest rates are low. But it still makes for an interesting comparison, given current politically-inspired emphasis on “the deficit” which is normally taken to mean the overall deficit.
Here, we have also looked at the data from 1970/1, also up to 2008, i.e. excluding the financial crisis, and taken the average annual overall deficit for Conservative and Labour governments respectively.
In the case of Conservative governments, over this period the average annual overall deficit is 2.9% of GDP, while for Labour governments in the same period, the average overall budget deficit is 2.6% of GDP.
Therefore, if this is taken as a further indicator of fiscal rectitude or conservatism, it appears that, over time, Conservative governments have been fiscally expansive and less “conservative”.
And again, we draw this conclusion as a statistical matter, not a value judgment on the wisdom of economic policy, since UK governments of both persuasions have under-invested in public infrastructure etc. over many years.
(As before, if we had continued to calculate the annual average up to 2015, this would have further widened the gap to the detriment of Conservative(-led) governments).
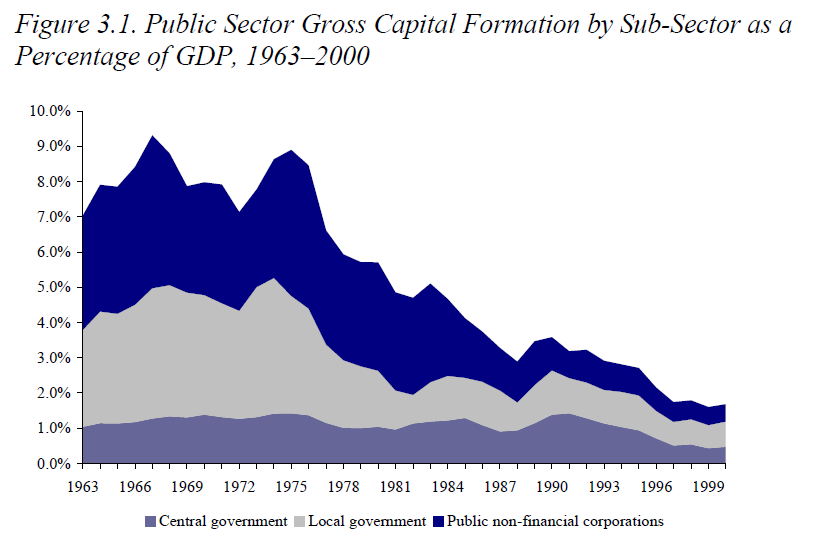
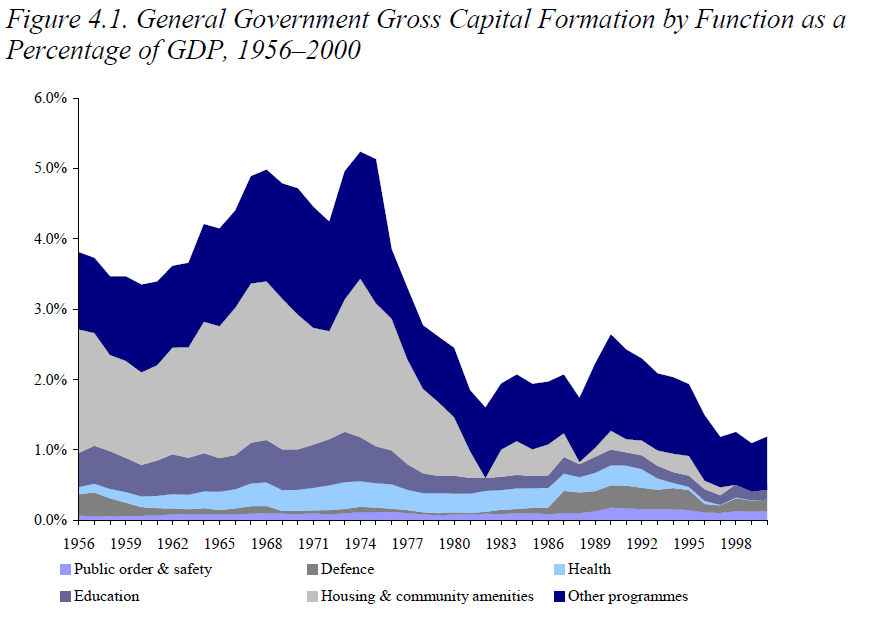
Public investment as a percentage of GDP
We have also examined annual spending as a share of GDP for gross and net (after depreciation) capital spending, also from 1971. Comparisons are more difficult in that there is a secular trend, since the early 1980s, for public capital investment to decline as a proportion of GDP. Thus over the 25 years from 1956 to 1981, gross investment never fell below 6% of GDP, peaking at 10.2% in 1968. But from 1989 on, it has been below 4% per year for each year save 2010, when it touched 4% as part of Labour’s mini-stimulus. To some extent, this decline reflects the privatisation of publicly owned industries and public assets (including housing).
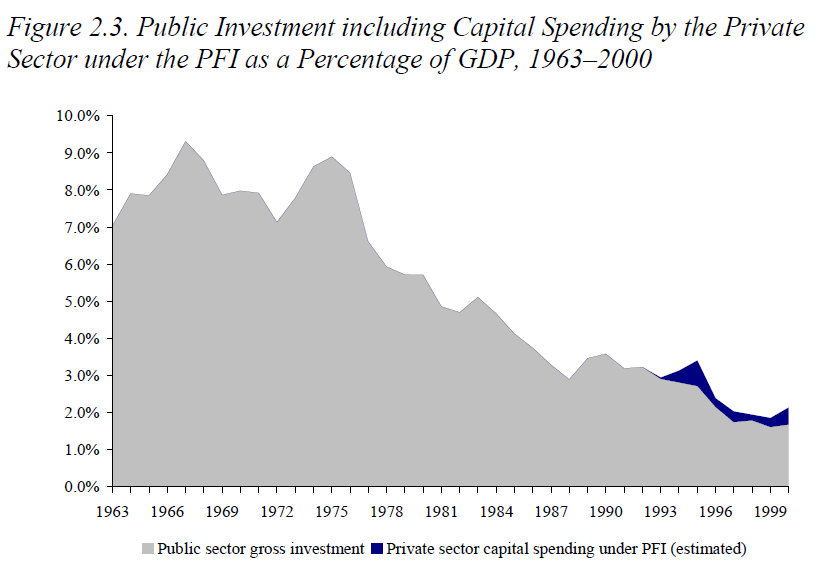
Since the mid-1990s, the level of capital spending has been somewhat masked (understated) by the use of PFI contracts by both Conservative and Labour governments, which in our view is an ideological, fiscally damaging and certainly “fiscally un-conservative” form of spending. Below, we reproduce an IFS chart (see Chart 3) from their interesting 2000 publication, “Twenty-five years of falling investment?” which estimates the capital value of PFI contracts at that time.
From the statistics, we find that over the period from 1971 to 2008, gross investment per year by Conservative governments was on average 5% of GDP, while that by Labour governments over the same period was 4.3%. This difference is also reflected in net investment; under Conservative governments, on average annual net investment is 2.4% of GDP, while under Labour governments it is 2.2% of GDP.
In terms of fiscal conservatism, we would suggest that a positive but not high level of investment funded wholly or almost wholly without recourse to borrowing would be seen as “conservative”. It appears, therefore, that Labour’s record of slightly lower investment funded by slightly lower levels of borrowing (see the section on overall deficits above) means that over time Labour has been somewhat more fiscally conservative in this regard too. Again, this is not a judgment on the wisdom of an economic policy that delivered a low average level of public investment.
The deficit and investment record charted
To pull several of the above strands together, the following chart shows the evolution from 1956 onwards of deficits and investment as shares of GDP (fiscal year ending Q1 of year). Deficits are broken down between current budget deficits and overall deficits, while investment is divided into net and gross.
Chart 1
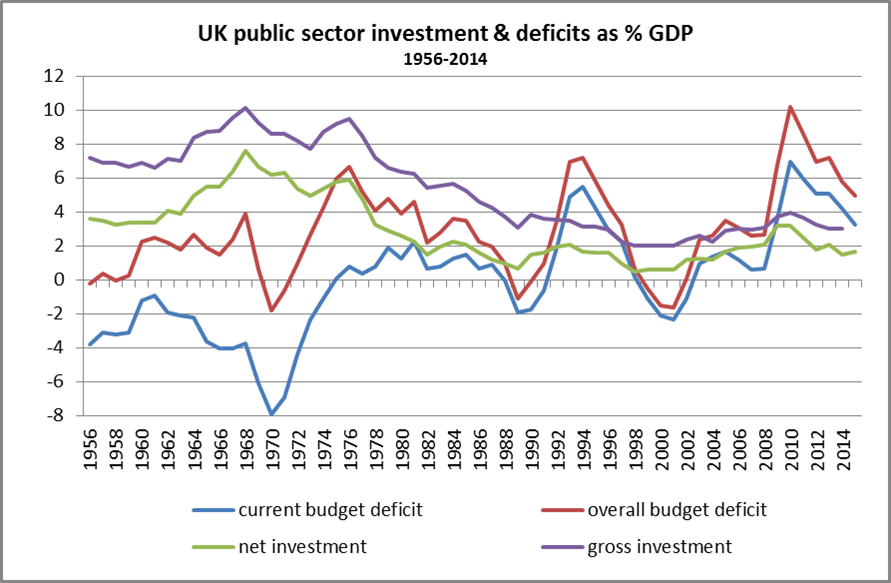
source: ONS
Note that the overall deficit, from 1956 to 1972, remained fairly constant around 0-2% per year (save only in 1969), i.e. well below the annual rate of increase of GDP. This meant that the debt to GDP ratio continued to fall despite the high levels of investment.
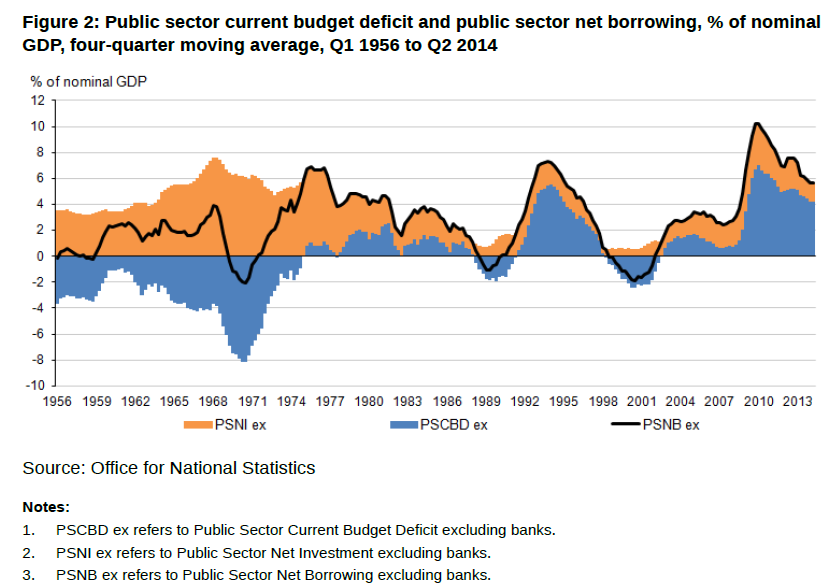
From ONS, the following chart shows the position just for current and overall budget deficits
Chart 2


10 responses
The Joseph Rowntree society and the Institute for fiscal studies are officially recognised respected bodies
http://www.uk.gov is also reputable (depending on which way you look at it):)
So are you disputing the figures Edward?
Paul your link does not refer to any reputable source, it just someone’s website?
Hi Edward, the sources are linked to on the right hand side
For pre 2010
http://ukpublicspending.blogspot.co.uk/2009/04/sources-for-public-spending-data-series.html
2010 onwards
https://www.gov.uk/government/collections/public-expenditure-statistical-analyses-pesa
I think he gets them all from data from government figures.
The figures are just numbers, you make no mention of what these amounts were used for. Without knowing what the spending was on or why it was spent then the figures are relitively meaningless. Although comprehensive it lacks detail and without that comparison doesn’t really help in deciding who is more financially profligate.
This site should tell you what you need to know
http://www.ukpublicspending.co.uk/past_spending
TRUE
Vote Conservative then according to this article
Eh?
Did you read it?
yeah think he missed that one.
ss