Two reports published today by the Office of National Statistics (ONS) show relatively weak UK data for the month of July – in production (including manufacturing) and in trade in goods and services. The July data (if confirmed in the coming weeks) are likely to have a slight braking effect on GDP for the third Quarter of 2015.
In a nutshell, July production fell 0.4% from the June figure, with manufacturing falling 0.8% on the month. The trade deficit for goods and services widened by £2.6 billion over the June figure.
July production figures
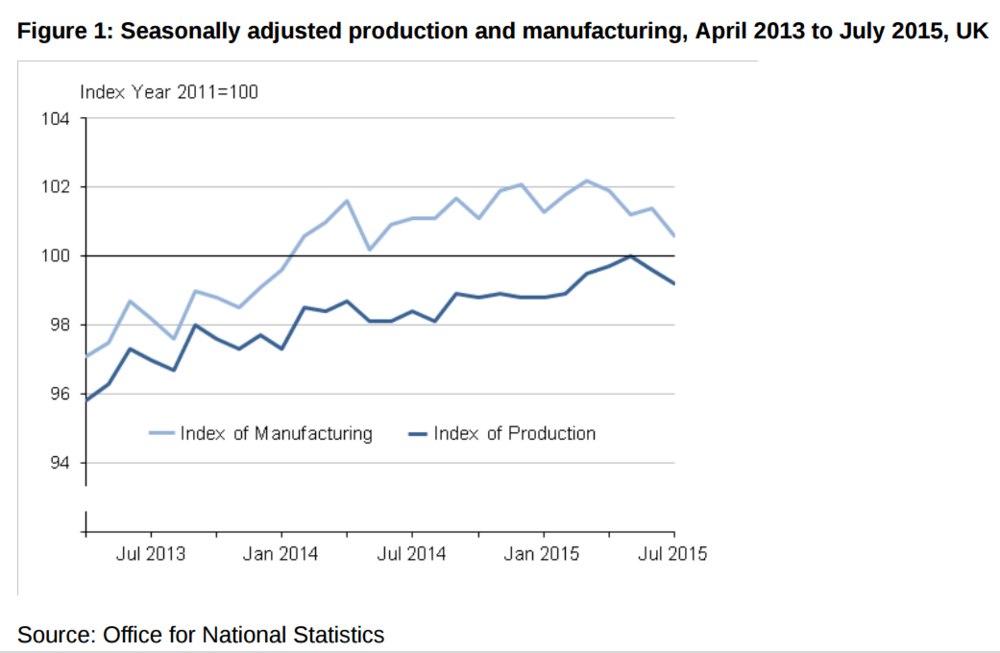
Total production output decreased by 0.4% in July 2015 compared with June. Manufacturing (by far the largest sector) fell by 0.8% – the largest fall since May 2014. Mining and quarrying increased slightly but within this, oil and gas extraction fell a little (for a second month). Supply of electricity, gas, water, waste management etc. all rose.
Looking at the position compared to a year ago, total production output is estimated to have increased by 0.8% in July 2015 compared with July 2014. The largest positive contribution was from
mining & quarrying, which increased by 6.7% – mainly due to oil and gas extraction, which is up a big 9% over the year despite recent falls.
However, manufacturing output actually decreased by 0.5% in July 2015 compared with July 2014. This is a strong indication that the aim of having a more balanced economy is far from being realised. The largest contribution to the decrease came from the manufacture of machinery & equipment, down 15.9%.
Taking the last 3 months to July 2015 compared to the same months in 2014, total production is up 1.4%, due heavily to the increase in oil and gas production. Manufacturing is up just 0.4% over the year, far below the rate of increase in GDP as a whole.
For the 3 months to July 2015, production and manufacturing were down 9.3% and 5.2% respectively from the pre-crisis GDP peak in Quarter 1 2008.
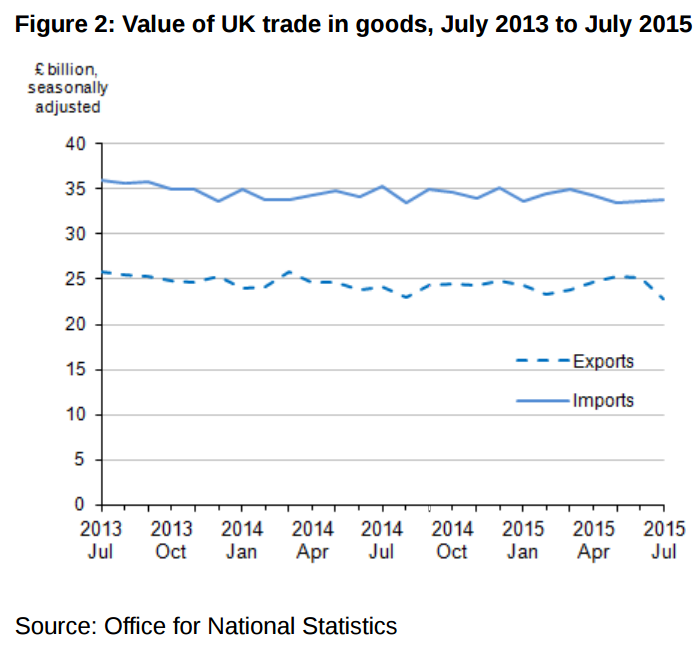
July trade figures