Is the UK economy heading straight for the rocks? John Weeks is not convinced. Image via Wikimedia https://commons.wikimedia.org/wiki/File:StateLibQld_1_101788_Lammershagen_(ship).jpg
Brexit Shock?
The most recent quarterly statistics for the UK economy show an increase in quarter-on-quarter GDP growth for the second quarter of 2016 compared to the first (up to 0.6% from 0.4%, or 2.2 and 2.0% on an annual basis). None-the-less many predict an imminent recession, to strike Britain before the end of the calendar year and perhaps in the current quarter.
The Office of National Statistics preliminary numbers for Q2 were released on 27 July and may be revised downwards later in August (the first estimate covers a bit less than half the sources of GDP). If that is the case, further falls in the third and four quarters could take GDP growth into negative numbers.
For most commentators the pessimism about GDP growth in the immediate future arises from what might be named “Brexit effects”, various types of anticipated and unanticipated weaknesses exacerbated or created by the vote to exit the European Union. Release of statistical indices from the market monitoring company Markit Economics seems to verify the pessimism (see the company’s website for detail).
Recessionary Political Agendas
Most media commentators agree that the Cameron government anticipated a “yes” win on 23 June and had no plan should voters not comply. Also clear is that the new government has no clear “extraction” strategy as yet. These uncertainties made anxieties about negative economic effects understandable.
However, if leaving the European Union has serious and negative economic consequences for Britain, it is not obvious that these should manifest themselves in the short run; i.e., in 2016 or early 2017. Also possible is a period of phoney stability that induces complacency before disaster strikes (if it does). Further, some if not most of the pessimism comes heavily laden with political agendas, which should induce scepticism or at least doubt about imminent recession.
Those who supported “remain” see recession as the fulfilment of their pre-referendum warnings. Unlikely as it may seem, opponents of Jeremy Corbyn wave the recession card as a tool in the fight for the Labour Party leadership. The current party leaders allegedly have no plan to deal with the recessionary disaster already unfolding (though what practical difference it would make is not clear since no Labour politician will making policy before the next election).
Assessing the Recessionary Likelihood
It should be possible even in this politically charged context to address at least the likelihood of a recession in the immediate future. Assessing what will develop in the longer term is much more difficult to the point of impossible. In May the Treasury suffered justified ridicule for its bogus projections of the cost of Brexit.
The first step in assessing the likelihood of recession requires defining the term. The Treasury definition of recession, used almost universally, specifies that the economy have a negative growth rate for two consecutive quarters, and specifies that the measure be the quarter-to-quarter growth rate. The frequently used alternative measure, comparing the second quarter of 2016 to the same quarter in 2015 (for example) is less likely to produce two consecutive negative values. Despite its arbitrariness, I use the quarter-on-quarter measure.
Using the common measure, I start by considering whether we should view the recent PMI indicators from Markit Economics as harbingers of recession. Despite its uncritical acceptance by the media, the PMI is not easily interpreted. Rarely if ever does a user of it (or Markit itself) point out that this is an ordinal index not a cardinal measure (Investopedia is an exception though it does not use the word ordinal).
The difference between cardinal and ordinal is very practical and easily understood. Age measured in years is cardinal (a twenty year old has lived twice as long as a ten year old). GDP growth also falls into the cardinal category – an economy growing at 5% expands twice as fast as an economy growing at 2.5%. Markit Economics calculated the PMI’s from surveys of businesses in which the respondent has only three possible answers to chose among, “better”, “same” or “worse”.
Two companies, one with an increase in orders of 25% and another with a 5% increase would both answer “better”. This alone renders the PMI’s ordinal. As a result, changes in the PMI’s indicate no more than “up” or “down”, never how much up or down. For example, at the end of 2015 the overall PMI for the UK economy declined from about 53 to about 52, and between June and July this year from just over 52 to just over 48, about one index point in the former case and four in the latter.
Because the PMI is ordinal, we cannot know which decline was greater. All we know is that more respondents reported “worse” in the latter case. That does not imply, for example, that the volume of new orders fell more in the latter case than in the former.
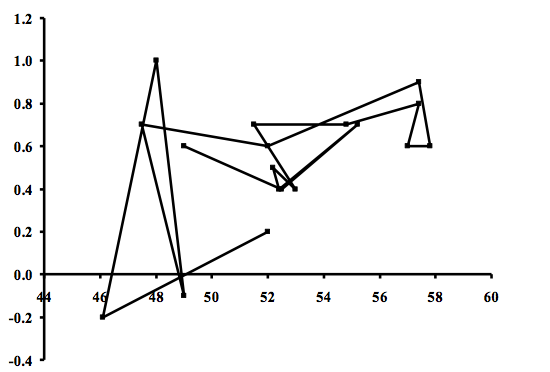
The nature of the Markit PMI’s provokes scepticism about the usefulness of the indices as indicators of economic trends (as “leading indicators”). The two charts below justify that scepticism. A glance at the first chart suggests that after 2012 quarterly GDP growth and the Markit index may be quite closely related, so that the downturn in the latter in July 2016 may foretell a fall in the former for the third quarter of the year.
The second chart, a “scatter diagram” with PMI vertical and GDP growth horizontal, indicates the opposite, almost no interaction. A bit of statistical analysis indicates no significant relationship between GDP growth and the PMI over the four years. A recession may arrive in 2016, but the Markit indices provide no guide (as the Office of National Statistics concluded for the Markit construction index).
Quarter-on-quarter GDP growth & Monthly Markit Index*, Time series 2012q1-2016q