It looks as if the UK’s GDP will have risen by a little over 7% in 2021, after a fall now estimated at 9.4% in 2020. (We await the Q4 data). It seems that – despite stronger November data – GDP in 2021 will come in below that of 2019, and maybe a tad less than 2018. Clearly COVID has played a major part, but is there also evidence of Brexit-induced slowdown in the mix?
The “Conservative Home” website (among so many other right-wing propaganda outlets) tries hard to keep spirits up and the – ever-receding – vision of post-Brexit economic success alive. Here’s Harry Phibbs (3rd January):
“The UK’s economy continued to grow – by 2.3 per cent in 2016, 2.1 per cent in 2017, 1.7 per cent in 2018, and 1.7 per cent in 2019. True, it fell in 2020, by 9.7 per cent – but that was due to the pandemic. We have bobbed back up over the last year. The eurozone has generally performed worse.” [My emphasis]
Actually, the Eurozone economy has not generally performed worse than the UK over the post-Referendum period, now more than 5 years. But neither has it done markedly better, in overall GDP terms. Here’s the chart that shows how, since the start of 2015, the UK, US, Euro Area and EU as a whole have fared, based on each Indexed at 100 for 2015 (OECD data)

The UK’s GDP increased slightly faster than the others prior to the Referendum, and then fell slightly behind the USA and EU in 2018 – but stayed very close to the Euro Area (EA) until Q2 of 2020, i.e. the start of the pandemic. According to the statistics, the UK then did materially worse than all the others, until Q2 of 2021. One reason for UK apparently doing worse in 2020 relates to the ONS’s strict methodology for calculating output ‘volume’ for public services like health and education – but that should have led to making up lost ground in 2021 as this reversed.
The USA and EU have remained well ahead of the UK, the EU by 2.8 index points at Q3. The Euro Area, however, is just 1.5 points ahead of the UK.
I have also looked at France and Germany as individual large member states of the EU and Euros Area, to compare with the UK’s ‘performance’. Here, we see that Germany (the largest EU economy) has in fact been a laggard over the last 5 years, and its GDP has increased at a lesser rate than the UK. This can be seen from the table below. France’s GDP has risen more than the UK’s over the period, but more so during the pandemic – so Q4 data, when in, may affect the comparison.
I have taken two GDP snapshots, and give the percentage change (increase) from the first to the latest. These relate (1) to the period from the Referendum to date (Q3), and (2) the period from the Referendum to Q4 2019, to capture the pre-COVID position.
From these, in the latest quarter we have data for (Q3 2021), the UK’s GDP was 4.4% greater than it was in Q2 2016 (the last pre-referendum Quarter), while the Euro Area’s was 6.5% greater than it had been 5 years ago.
But comparing Q4 2019 (the last Quarter before the pandemic started to bite) with Q2 2016, the UK’s GDP was 6.1% greater, while the EA’s was up 6.9%, and the EU as a whole up 7.6%.
Percentage changes in GDP over the periods:

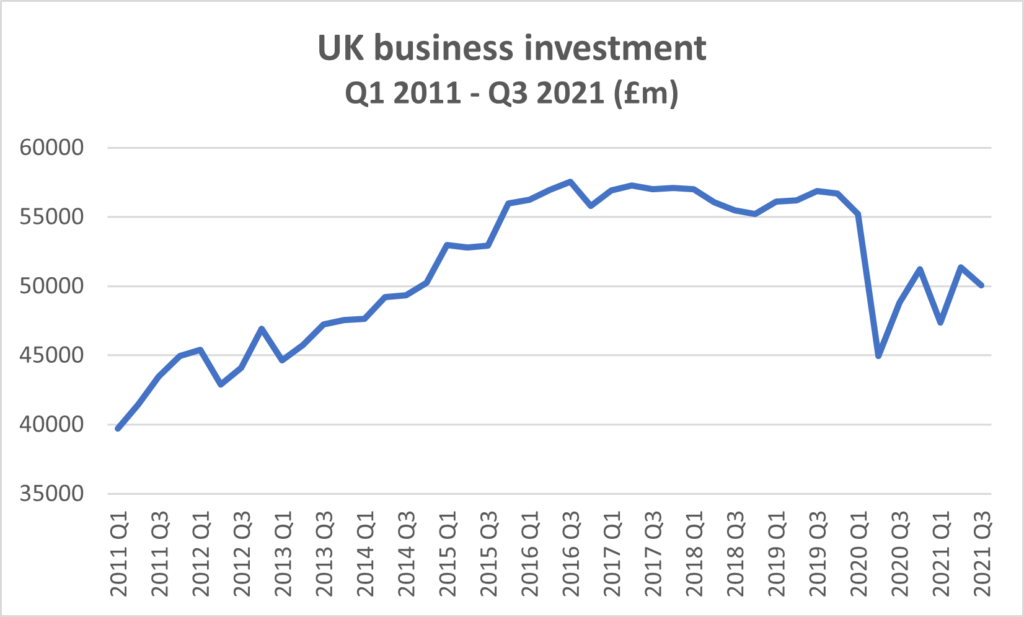
It seems highly likely that a key reason for the UK’s somewhat poorer performance than EU, EA and USA is to do with the stagnation, then fall, in business investment from 2017 on. From the next chart, you can see that real-terms business investment rose fairly steadily from 2011 till mid-2016, then more or less plateaued following the Brexit Referendum, till falling sharply when the pandemic struck – and the rather hard Brexit became a reality.

Decline in trade
The other big trend to date which is almost certainly Brexit-related is the fall in trade volumes. In real terms, i.e. allowing for inflation overall trade has fallen sharply since Q4 2019, due to a combination of Brexit and pandemic issues which cannot yet be easily separated out, though the falls in volumes of trade with EU countries since the start of 2020 indicates a major shift in the balance of trade.
But the falls in volume are stark and startling, and worth a separate post to go in detail. Let us simply compare Q3 2017 (which was not the peak year for exports or imports) with Q3 2021, and we find that
Overall (goods + services) exports fell by 11.7%
Overall (goods + services) imports fell by 7.5%
Exports of goods fell by 16%
Imports of goods fell by 5.2%
Exports of services fell by 6.7%
Imports of services fell by 14.1%
Preliminary conclusions
The UK has since the Referendum in 2016 performed worse (in terms of GDP) than our European and US comparators, including the Euro Area. But until the pandemic struck, the difference was modest. We need to wait several months to see if the UK catches up as (if) we emerge from the negative economic impacts of COVID. But equally, there is no evidence to date of a major negative GDP impact from Brexit. The two worrying signs are (a) the lower levels of business investment since 2017, and (b) the post-2019 severe fall in volume of trade. We need to follow these indicators closely in the coming months, to start to assess the more sustained GDP impact of Brexit.
It has always been PRIME’s position that the really negative longer-term impacts of Brexit would lie in the political and diplomatic arenas, with a political lurch to the right. That remains our view, and indeed the proven reality.


