Image with acknowledgment to pixabay.com
Much of the debate over Brexit focuses on narrowly on trade in goods. In that debate one finds relatively little discussion of the performance of the EU internal market with regard to commodity trade (“goods”). The typical argument for the British government negotiating a post-Brexit agreement presumes that EU internal market rules facilitate robust trade outcomes, and that operating outside of it would undermine goods trade. But has the EU internal market in fact facilitated trade among members? How should that be assessed?
One aspect of the European Union, the most important aspect for neoliberals, is the internal market, frequently mis-named the “single market”. The EU internal market is a customs union embedded within a form of political union in which the member governments have agreed to more favourable commercial relations among themselves than the group allows non-members. This is frequently and inaccurately summarized as “free trade” among members, and trade protection against non-members.
The terminology is inaccurate because no trading relations are “free” if by that word one means without regulations. Environmental and other regulations apply within the European Union, that define what can and cannot be traded. Because of these regulations the EU internal market does not have “seamless trade”, a frequent and misleading cliché. Whether the specific regulations governing EU internal trade are more or less restrictive than those applying to non-members is an empirical question.
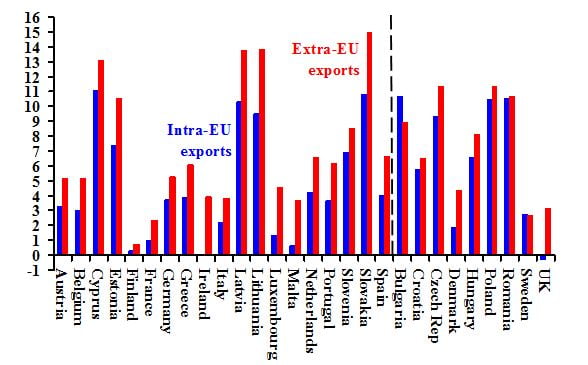
As should be obvious, EU regulations would have a different impact on extra-EU imports than on extra-EU exports. Extra-EU imports must conform to intra-EU regulations, while extra-EU exports need not do so. In practice, a producer in an EU country can export goods outside the EU that would not be allowed within the EU because of infractions of safety or other regulations.
This asymmetry, that extra-EU exports may face less regulation than extra-EU imports, suggests the possibility of different patterns for exports and imports, which is what the statistics indicate. Figure 1 shows annual rate of growth of intra- and extra-EU imports for the 19 euro zone countries and the 9 EU countries with national currencies, from the introduction of the euro in 2001 through 2017. Of the 19 euro zone countries, a bare majority, 10 of 19, intra-import trade grew faster than extra import trade. Among the non-euro countries, in 7 of 9 intra-EU imports grew faster.
One would have expected the opposite result. One purpose of the introduction and adoption of the euro was to reduce transactions costs, thus making trade among euro users cheaper and more “seamless”. The statistics indicate the contrary, which suggests that any cost-reducing role of using the euro was outweighed by other effects. One such effect might relate to level of development and structural characteristics. The ten countries in which intra-EU imports grew fastest were from the Baltic region or central Europe, in transition from centrally planned economies (annual rates in percentages): Lithuania (10.9), Slovakia (10.7), Romania (10.5), Bulgaria (9.2), Latvia (8.7), Estonia (8.6), Czech Republic (8.5), Poland (8.3), Hungary (6.7) and Slovenia (5.1). For all ten except for Slovenia, intra-imports grew faster than extra-imports.
Figure 1:
Annual rates of growth of intra-EU imports and extra-EU imports,
Euro zone and non-euro countries, 2001-2017 (percentages)
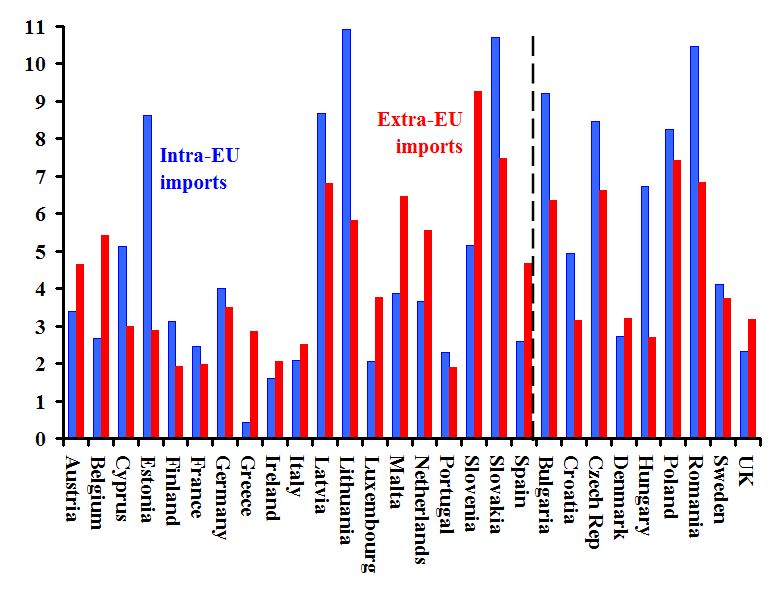
Note: Rate of growth calculated by using end years. Black line divides the 19 euro zone members from the nine non-euro countries. Source: Eurostat.