By Jeremy Smith
We’re sticking for the moment with this story because it exemplifies the perverse relationship between current UK and European political decision-makers and “mainstream” economists who have given intellectual succour and support to the now demonstrably failing austerity policies. That is why the unveiling of the manifold errors and wrong conclusions of Reinhart and Rogoff in their now infamous paper of January 2010 “Growth in a Time of Debt”, which we referred to in our previous post, is so important.
To show how their “findings” have been used politically, here is an example from less than two weeks ago, when our old ‘friend’ Olli Rehn, EU Commissioner for Economic Affairs, addressed the International Labour Organisation on 9th April:
“Yet, public debt in Europe is expected to stabilise only by 2014 and to do so atabove 90% of GDP. Serious empirical research has shown that at such high levels, public debt acts as a permanent drag on growth. If it is not reduced, it will become an ever-heavier burden on our economies, eating resources that could otherwise be channelled into productive investment needed to support job creation.” (our emphasis).
Thanks to the Political Economy Research Institute of the University of Massachusetts, Amherst, we now not only an explanation of the severe shortcomings of the R & R paper and conclusions, but also to the data used by R & R having finally agreed to open up access to them.
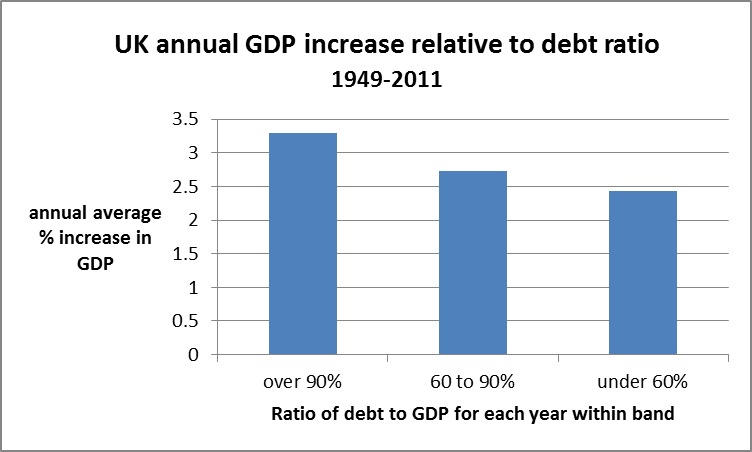
The R & R study covers a fairly large range of countries and a very long (200+) year period, but we felt it would be good to re-look at the UK post-war experience for the period 1949 to 2011 and see how far the R & R conclusions – in effect those drawn by Mr Rehn in his speech – are supported or not by this period of over 60 years. The answer is – the UK data go in the absolute opposite direction from that which the Reinhart and Rogoff ‘thesis’ would lead us to expect. In our last post we came to the same conclusion, from instant research using IMF and ONS statistics. And we have now obtained very similar results using the same data (plus adding the latest figures up to 2011, which do not alter the position) as was available to Reinhart and Rogoff.
What we find is this:
- For the 16 years from 1949 to 1964 when UK debt as a percentage of GDP was over 90%, annual GDP grew on average by 3.29%
- For the 7 years from 1965-70 and in 2010, when UK debt as a percentage of GDP was from 60 o 90%, GDP grew on average by 2.73%
- For the 40 years from 1971 to 2009 and 2011, when debt as a percentage of GDP was under 60%, GDP grew on average by 2.43%
So by far the best average annual rate of growth was achieved during the very period when the UK debt to GDP ratio was highest, and the worst average rate of annual GDP increase was when the debt to GDP ratio was lowest! And as we noted, the high post-war debt kept on reducing year by year.

post R & R chart 2
Data sources: ONS, Reinhart & Rogoff via PERI, University of Massachusetts at Amherst
Of course we don’t argue that a high debt/GDP ratio itself causes a higher rate of GDP increase. But given how crudely the R & R paper has been used for political advantage by the Austerian camp, it’s important to highlight not just their spectacular failings in methodology, but also the absurdity of the ‘findings’ of what Mr Rehn told the ILO was “serious empirical research.”


2 responses
Yes, sure, in case of UK debt is not important, especially in the after-colonial era. The reason is that relatively slightly before that period, 1949+, they ripped off half of the world’s goods, and… plus, established a war time economy prior to that period, with huge constraints and shortages… Someone said “forced war austerity with colonial stockpile”. Yep, right and true.
You should also read thishttp://www.economonitor.com/lrwray/2013/04/20/why-reinhart-and-rogoff-results-are-crap/