Analytical Considerations
As Brexit is finalized we find considerable speculation about the likely consequences for the UK and EU economies after the end of January. Because this event has no clear precedent, much of the speculation derives from political predilections and opinion without an analytical anchor. Since private investment plays a major role in both growth and diversification of economies, beginning with the motivation to invest might provide that anchor.
As Keynes argued, private investment has both a long run underlying technical link to production while driven by the expectations of capitalists (Keynes 1936, Chapter 12). In the long term, the economy’s investment share adjusts to the technical requirements of production, the amount of capital input needed to achieve the level of output sought by businesses (the technical term is the “capital-output ratio”).
Expectations intervene in two ways. First, expectations of future economic expansion will strongly influence the planned output of businesses. Low expectations for sales growth will prompt modest investment plans, which will fulfil the expectation of slow expansion. Second, short term pessimism provoked, for example, by recession, can cause a collapse of investment as occurred in the developed economies during 2008-2010.
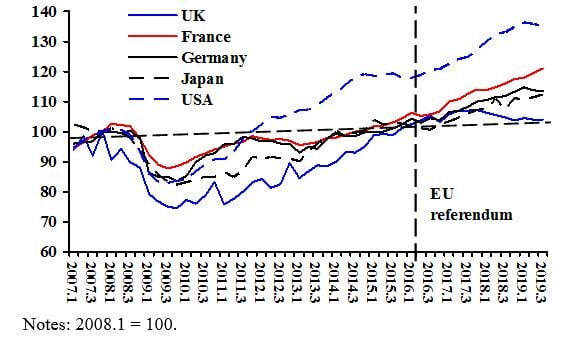
The first chart below shows GDP growth for five large developed economies. It begins with 2007, the last year of expansion before the Global Financial Crisis. I do not include the two largest developing economies, China and India, because factors strongly influence their growth that do not affect the five countries in the chart. Perhaps most notable are the growth-enhancing productivity gains associated with large scale transfer of labour from rural to urban activities.
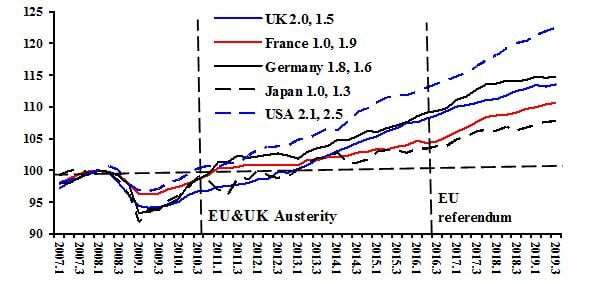
Because my focus is on the effects of the UK leaving the European Union, I divide the years into three periods, the great contraction (2007-2010), the period of EU and UK fiscal austerity (2010-2016), and the quarters following the unexpected defeat of the UK referendum on EU membership. The most obvious inference from the chart is the slow recovery from the deep recession of 2008-2010. These slow rates of recovery would in themselves tend to provoke pessimistic expectations for business investment.
Second, only two countries show a negative impact of the UK vote on EU membership. As expected, the UK itself has a drop from an annualized rate of 2.0% to 1.5. Negative though less pronounced is the change for Germany, from 1.8% to 1.6. For France an increase appears substantial. The results are consistent with what we would anticipate, an apparent negative impact for the major EU trading partners UK and Germany, and no negative impact for the USA and Japan.
Chart 1: GDP Growth for Five Large Developed Economies, 2007.1-2019.3
Notes: Numbers in legend are growth rates for 2010.3-2016.3 and 2016.3-2019.3. Base is 2008.1 = 100. Source: OECD.
Investment Impact
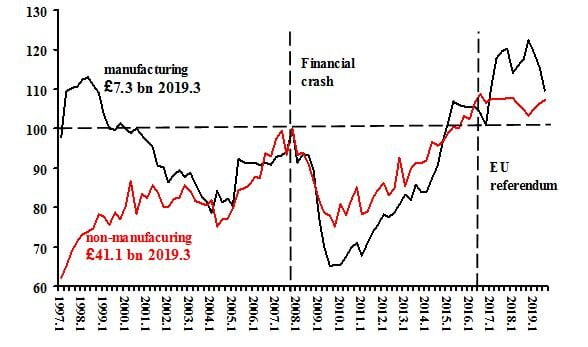
Two more charts switch from GDP to private investment for the same five economies as in the previous. The first shows amounts at constant prices, all countries set to the base period at the start of the great contraction, 2008.1 =100. The initially striking result is that investment by UK companies has increased consistently below the level of the other countries except for a few quarters after the EU referendum.
The recovery of UK private investment after the great crash matched that of France and Germany into 2016, though below the US recovery. However, in late 2016 and early 2017 UK investment peaked then declined slightly. In the four other countries investment continued to grow, except for the mid-2019 declines in USA and Germany. Thus, we have evidence of UK investment stagnation soon after the EU referendum.
Chart 2: Total Investment for Five Large Developed Economies, 2007.1-2019.3
(constant prices, 2008.1 = 100)
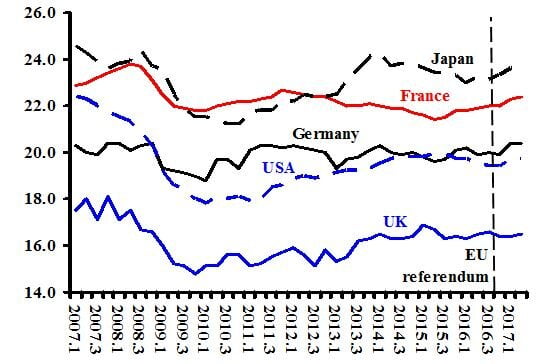
In 2017 the UK Office of National Statistics published a study of private investment shares that included the five countries in our previous tables. The statistics end in mid-2017, but have the advantage of cross-country consistency. The results, shown in the third chart, place the apparent UK investment stagnation in context. The UK economy for two decades and longer has had the lowest private investment share among the five countries.
The low UK investment share has in part a technical explanation. Of the five countries, the UK economy has the lowest share for industrial production. The reasonable assumption that investment-output ratios are lower in services (including finance) than mining, manufacturing and construction helps explain the long term UK pattern, avoiding subjective judgements about investment motivation by UK capitalists.
The chart shows for the UK a steady investment share, which began over a year before the EU referendum. It is extremely unlikely that UK capitalists could have anticipated the referendum vote so far in advance. For all five countries the investment share in 2017 had recovered to its pre-crash level, suggesting an underlying relationship determined by the composition of production by sectors.


