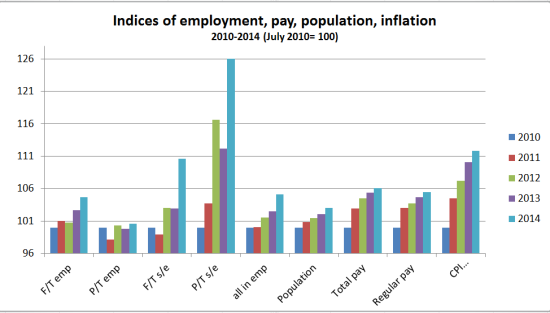
The statistics are all taken from ONS and rebased to 2010, which is shown as 100. For employment stats we take May to July for each year. For population, it is the annual figure, rolled forward into 2014 by assuming a 600,000 increase (as in 2013). For pay, we take July figures for each year. For CPI, we take the July figures.
From the chart, we see that total population is estimated to have increased over the 4 years by 3.03%, while total employment (i.e. employees + self-employed) has increased by 5.12%. Full-time employees are up by 4.71%, while part-time employees have scarcely shifted, up just 0.59%. The bigger percentage changes are in self-employment, up 10.6%, while part-time self-employment has risen 16%.
Total wages (including bonuses) are up in cash terms 6%, while regular wages are up a bit less, at 5.4% in 4 years. This is to compare with CPI inflation, up 11.8%. The cumulative loss of purchasing power of regular wages (adding each year’s loss) comes to some 16.7%.


